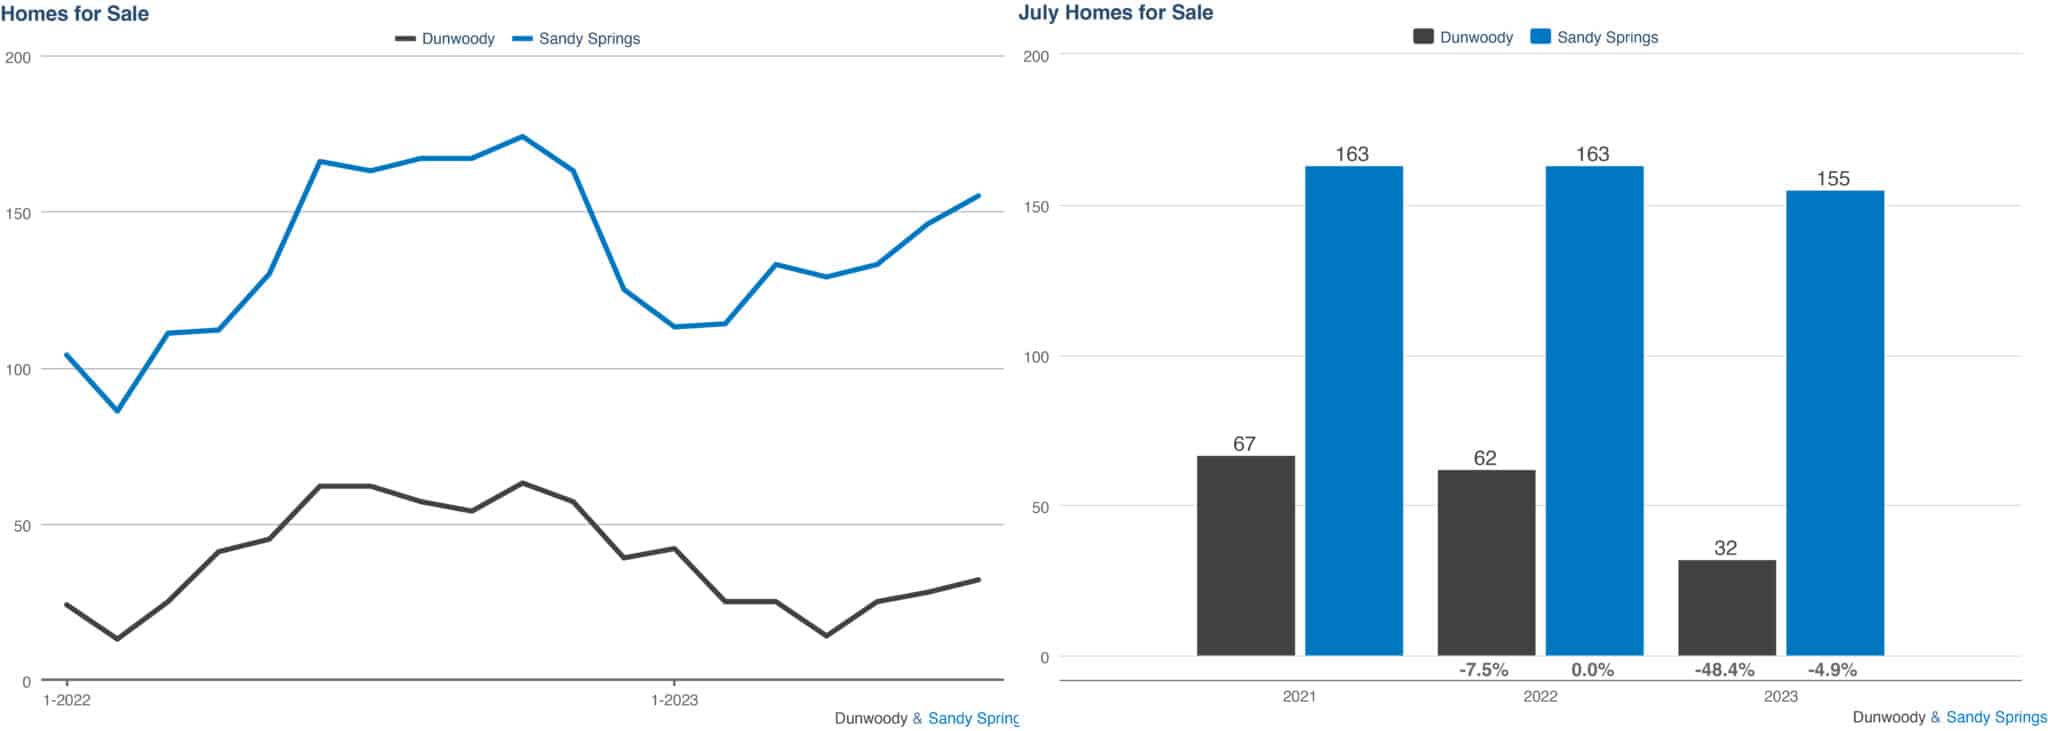
In July, the real estate market in Dunwoody, Sandy Springs, and the surrounding areas maintained its robust demand. Similar to the nationwide trend, there was a slight increase in supply compared to previous months. However, this increment was insufficient to counterbalance the persistently strong seller’s market, as the supply levels remain at only half of what they were in 2019.
Key Points
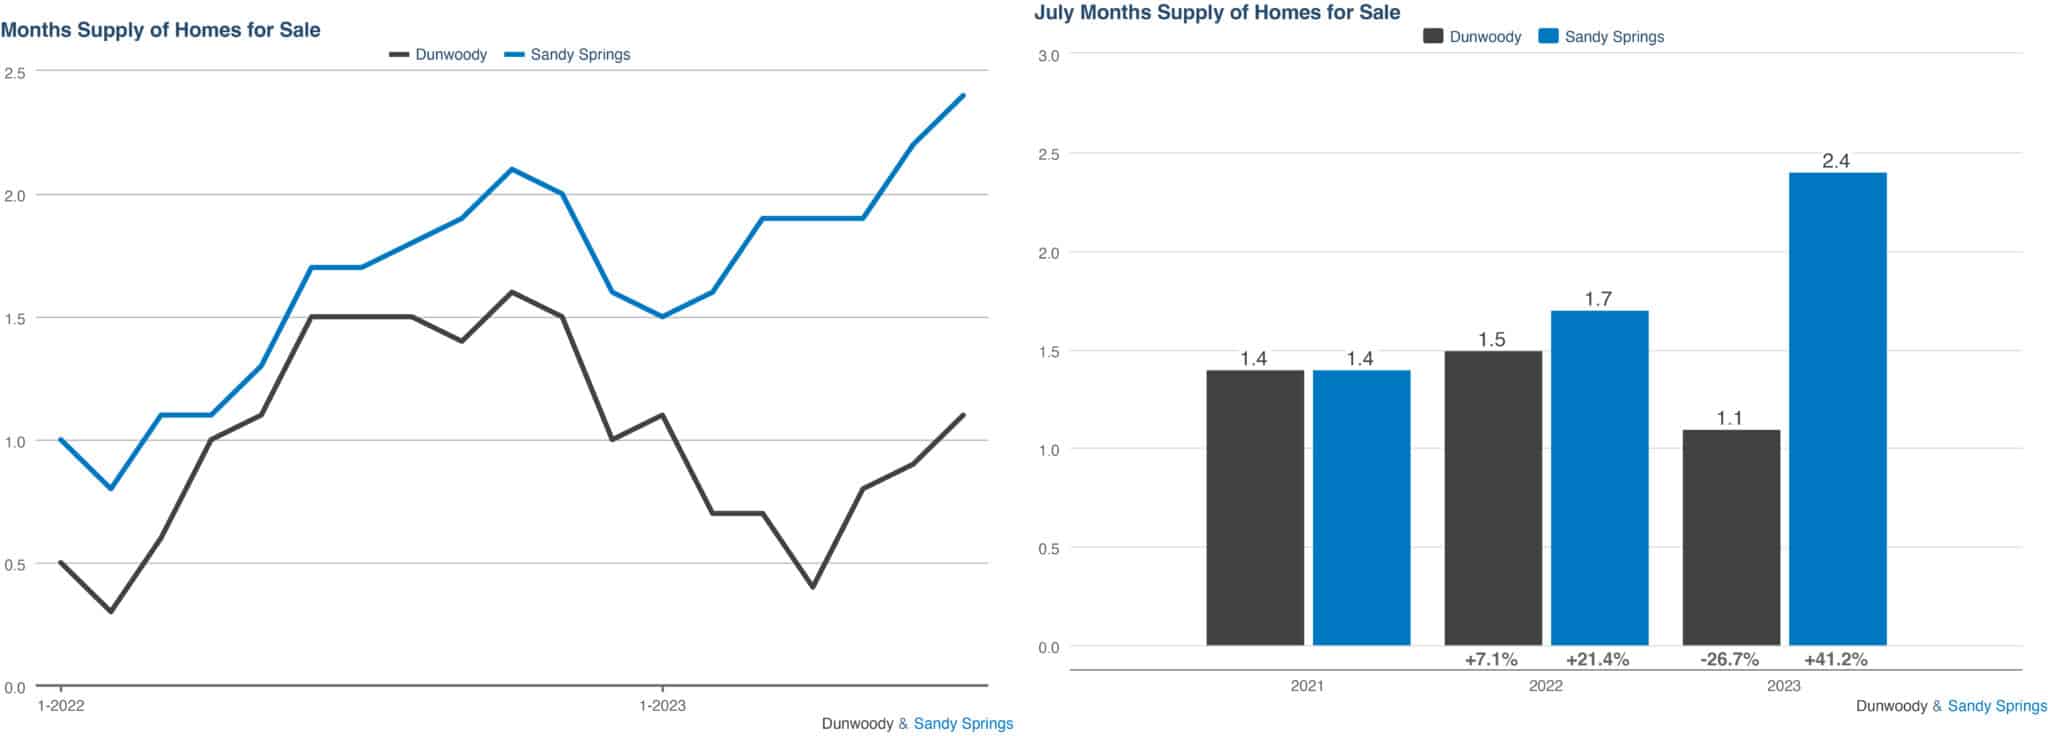
– Dunwoody’s supply of homes is down considerably compared to this time last year and 2021.
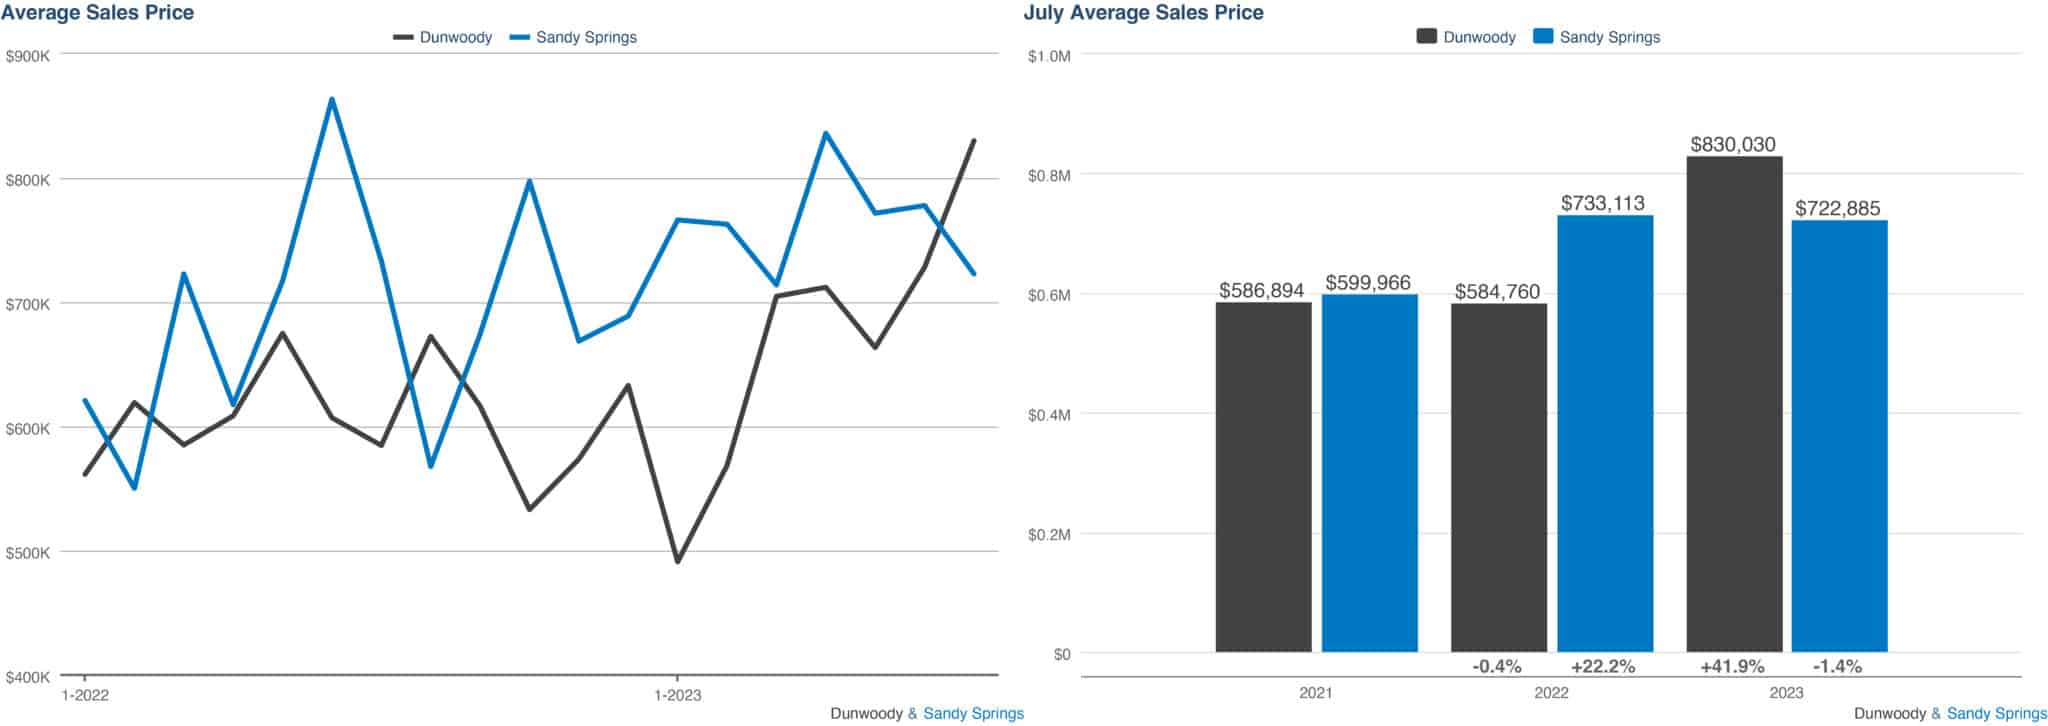
– The average sales price in Dunwoody continued to increase from June and is considerably higher than 2022 and 2021’s July average sales price.
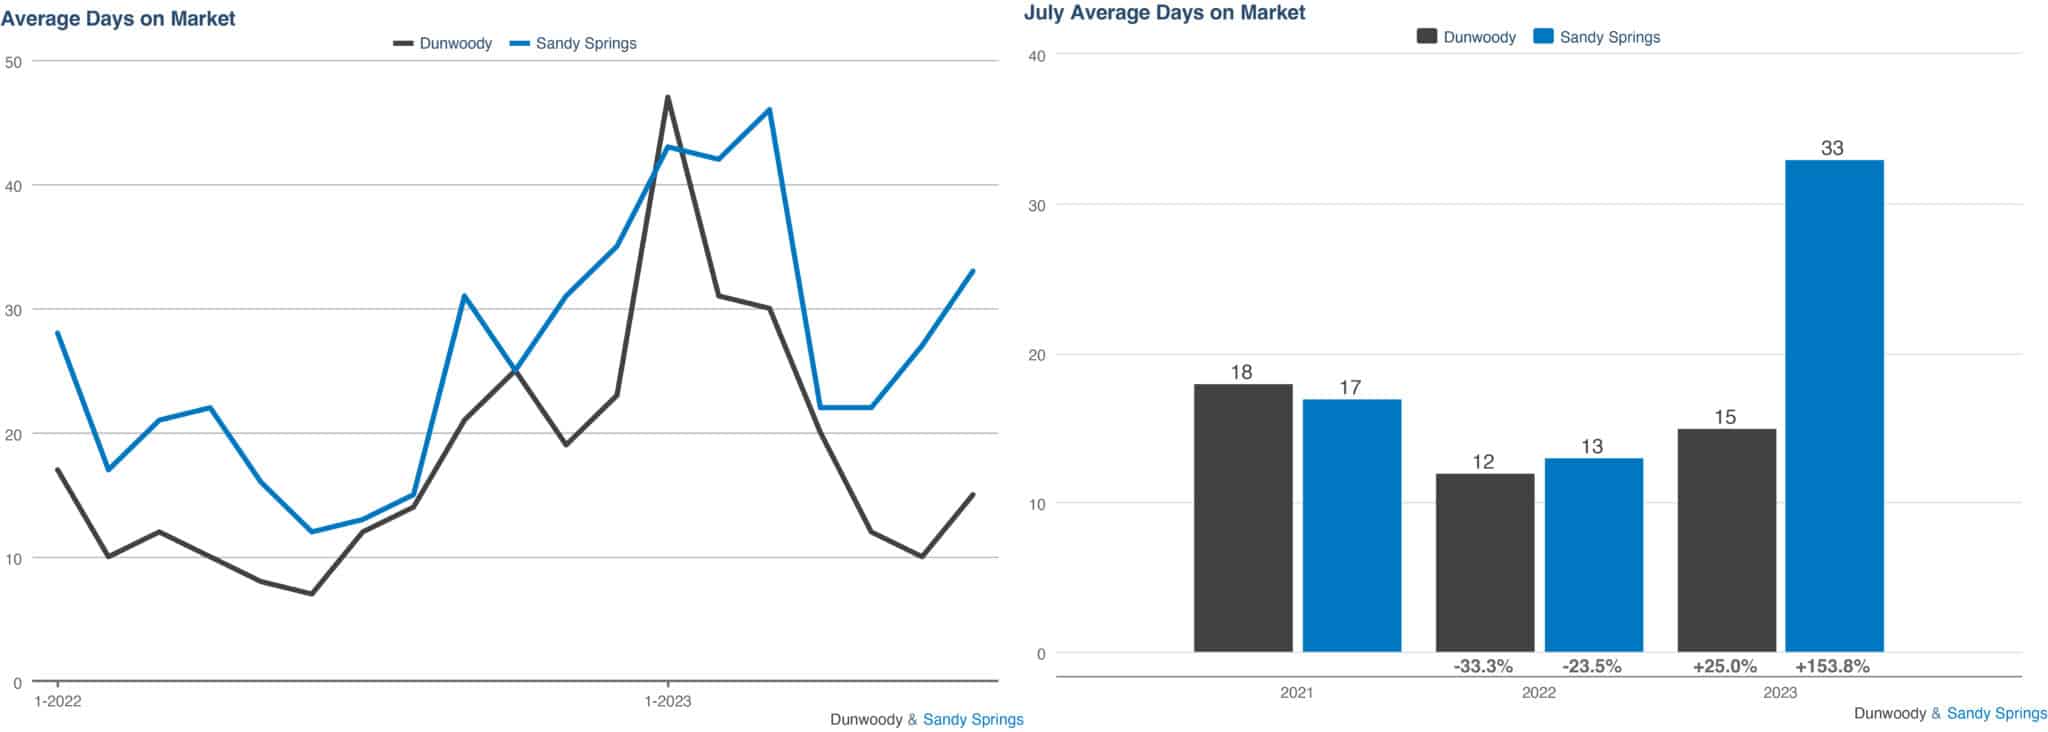
– In both Dunwoody and Sandy Springs, houses are sitting on the market for slightly longer.
Average Sales Price
In July, there was a consistent upward trend in the average sales price within Dunwoody, reaching a notable $830,030. This marks a substantial 42% surge from the previous year’s figure of $584,760. Conversely, Sandy Springs experienced a slight decline from $777,831 in June to $714,903 in July. However, it’s worth noting that the average sales price in Sandy Springs remains comparable to the levels observed during the same period last year.
In summary, Dunwoody witnessed a significant increase in average sales price compared to the previous year, while Sandy Springs demonstrated stability in line with its past performance.
Average Days on Market
During the month of July, both Dunwoody and Sandy Springs experienced a rise in the duration that houses remained on the market. In Dunwoody, the average days increased from 10 to 15, a pattern consistent with historical trends —18 days in July 2021 and 12 days in July 2022. In contrast, Sandy Springs saw a more pronounced deviation, with the average days on the market increasing from 27 to 32. This notable shift stands in contrast to previous years’ data.
In summary, July brought an increase in the time houses spent on the market in Dunwoody and Sandy Springs. While Dunwoody’s trend aligned with past years, Sandy Springs displayed a more significant departure from its historical pattern.
Months Supply of Homes for Sale
Sandy Spring and Dunwoody both saw an a small increase in months supply from June to July. Compared to this time last year, Dunwoody is showing a 27% decrease in months supply. Sandy Springs, on the other hand, is showing a 41% increase compared to this time last year.
Homes for Sale
In July, both Dunwoody and Sandy Springs observed a modest rise in the number of new homes available for sale. Dunwoody witnessed a slight increase from 28 homes in June to 33 homes in July, indicating a 47% decrease compared to June 2022 when there were 62 homes available. Similarly, Sandy Springs experienced a small increase from 145 homes in June to 148 homes for sale, representing a mere 4% decrease compared to the previous year.
Pending Sales
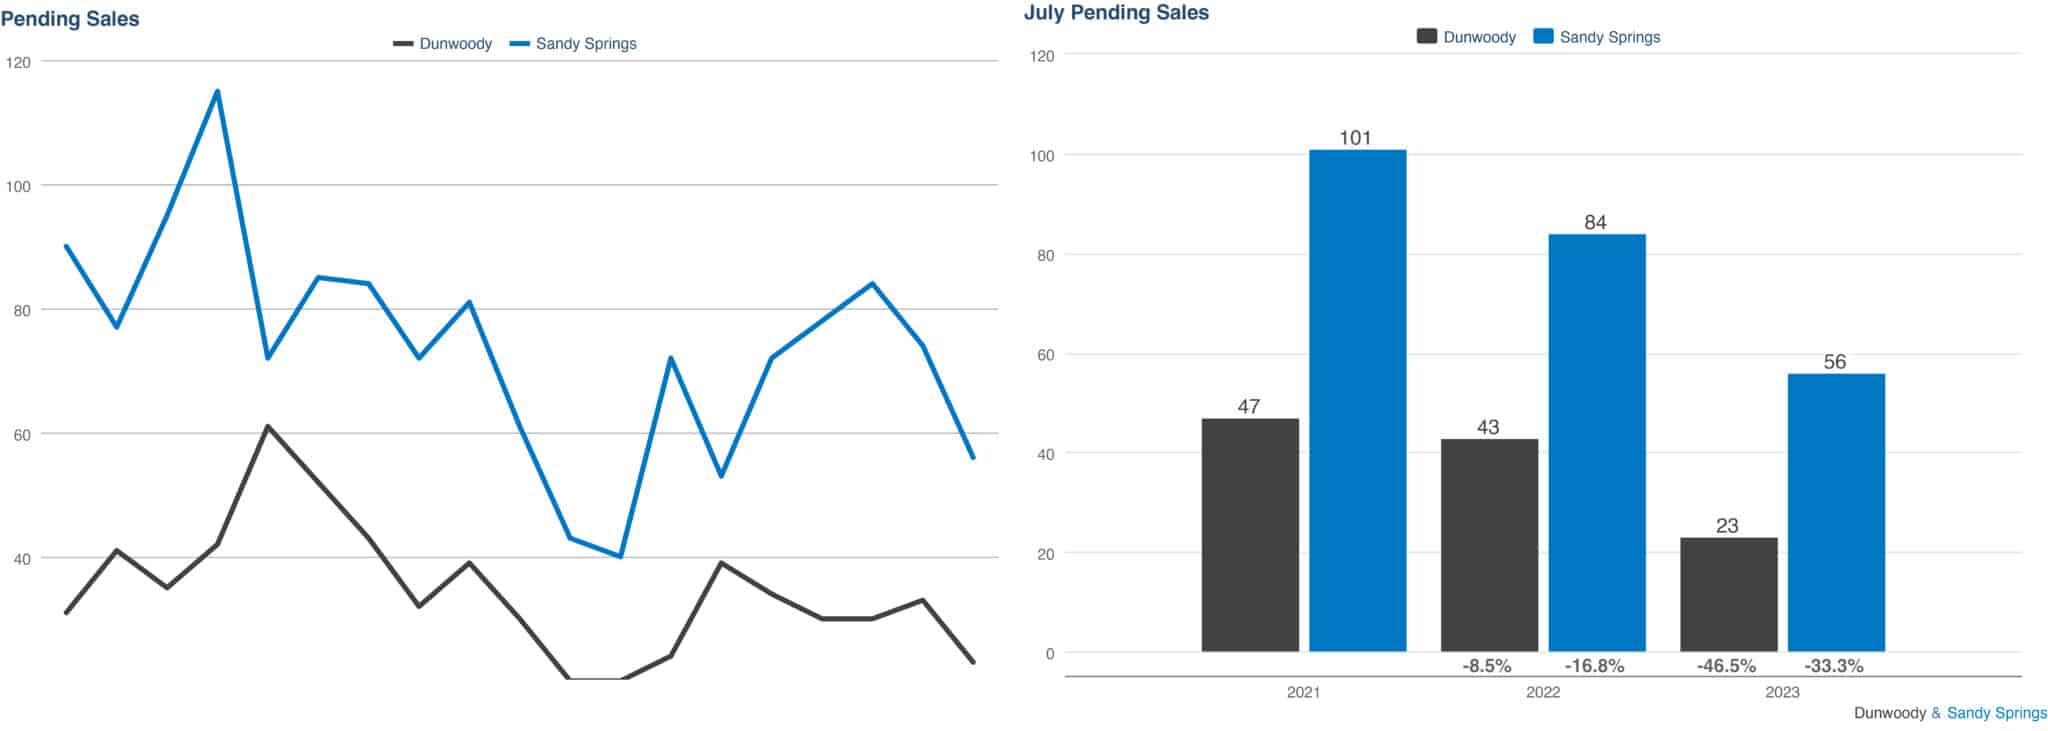
In July, the number of pending sales in Sandy Springs continued to dip, reaching 69 compared to 77 in June. Similarly, Dunwoody decreased from 33 to 24 pending sales. When compared to July 2022, Sandy Springs observed a 33% decrease in pending sales, as it had a total of 84 pending sales during that period. In contrast, Dunwoody experienced a significant 47% decrease from July 2022 when there were 43 pending sales.
Key Takeaway
In brief, as the supply once again decreased, we observed a rise in the average sales price. To put it plainly, the availability of homes for sale is insufficient. Buyers are faced with limited choices, which is why if you’re contemplating selling, collaborating with an agent to formulate a well-thought-out strategy for pricing and marketing can make your house stand out. Seize the opportunity today and get in touch with our team to gain insights into market trends and discover how our expertise can assist you in reaching your real estate goals.
*All data from First Multiple Listing Service. InfoSparks© 2023 ShowingTime.
